A good water quality is the base of a healthy ecosystem with rich biodiversity. Aquatic ecosystems also provide essential services for drinking water, irrigation, recreation, aquaculture and fisheries. The EU Water Framework Directive (WFD) recognizes this and requires member states to monitor and, if necessary, improve water quality. Also the Marine Strategy Framework Directive and the Bathing Water Directive require frequent monitoring.
Although the spatial component is key to gain insight in the processes in water, regular sample-based monitoring only provides point data. Several parameters that are used to determine the ecological status (e.g. phytoplankton biomass, turbidity) can be measured by Earth Observation, increasing the spatial representativeness of the measurements as well as in some cases the measurement frequency. Earth Observation (EO) will also help to understand the system, and can help to identify sources, which will help to take the most effective measure. EU consortia EOMORES, CoastObs and a long list of international experts promote the use of Earth Observation to support the monitoring for the WFD in the White Paper “Satellite-based water quality monitoring, reporting and management for the Water Framework Directive” (download from ZENODO)
We provide up to daily mapping services for Water Framework Directive monitoring. Also histograms, time series and spatial-temporal aggregated status classes can be provided for your area.
An interactive example from our WFD mapping service can be found in the satellite portal of the Netherlands Space Office (link). The example is based on the pilot we carried out in Lake Lauwersmeer. Unfortunately, this portal is not accessible from outside the Netherlands. Below we provide a screenshot. Are you interested in our service or in a demo for your area, please contact us.
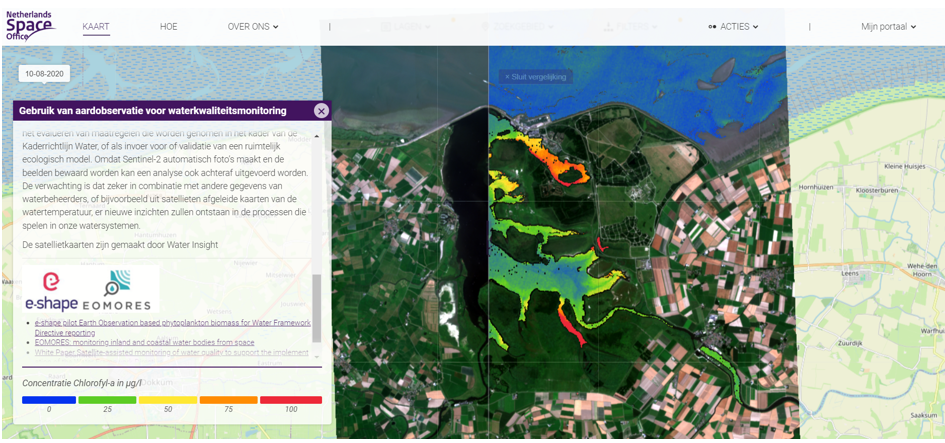
The WFD mapping pilot for lake Lauwersmeer was carried out under the flag of the e-shape project. More information about e-shape can be found via this link.
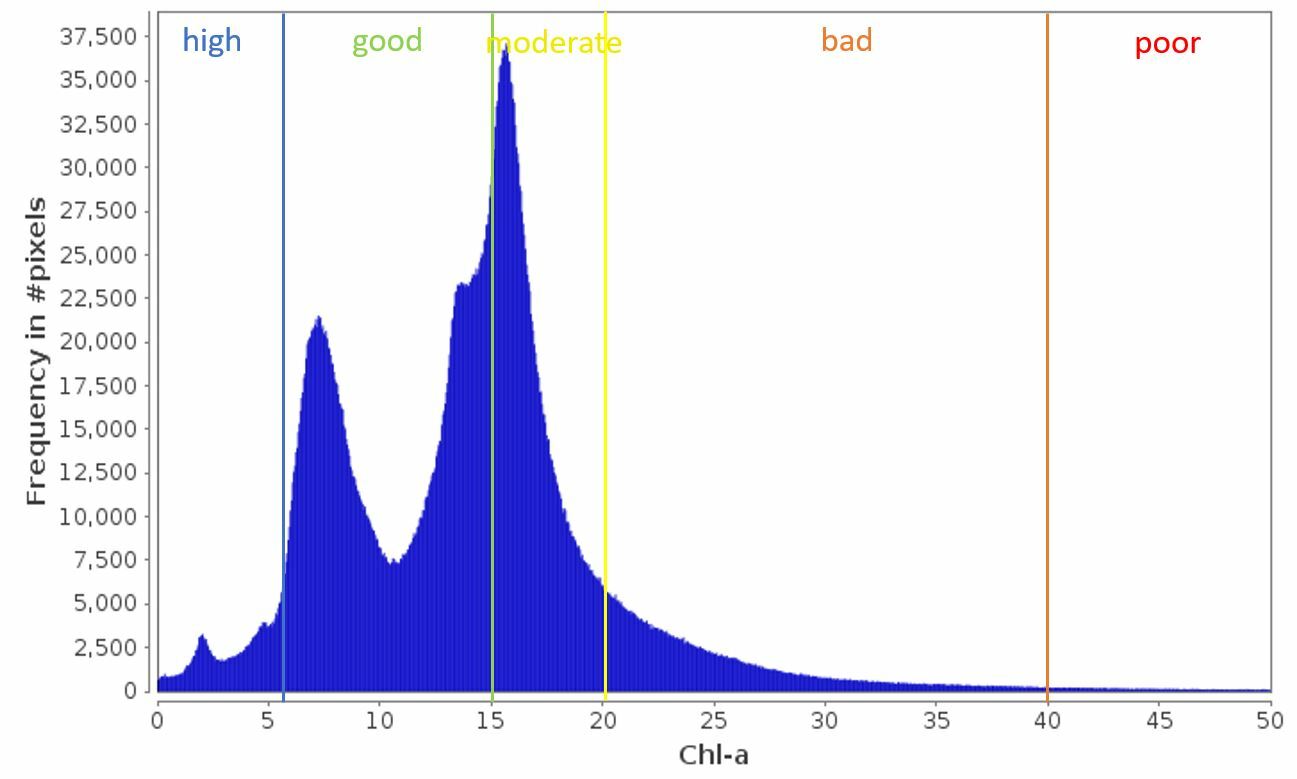
An example of an histogram of Chl-a values based on a satellite image. Clearly, there is not one single ecological status for this area.