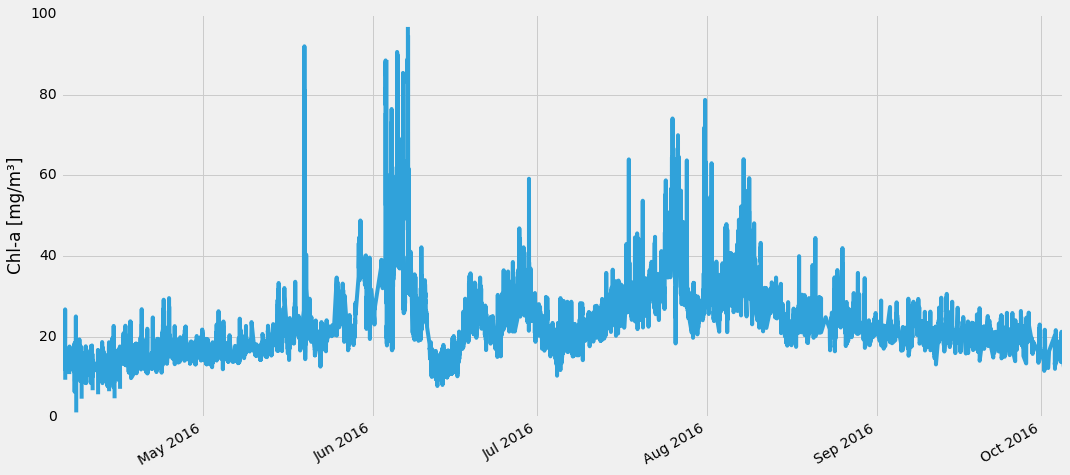
Our continuously registering instruments measure the colour of water and derive e.g. the concentration of Chlorophyll-a from that measurement. An example time series plot of a eutrophic lake in the Netherlands typically shows the lower values in early spring and autumn when light levels are low. Peaks occur in periods of prolonged sunshine. Variations during the day due to migration and mixing can be followed into detail. From the optical data similar High Frequency Data time series of e.g. transparency and the presence of cyanobacteria can be derived. Our methods have been published and well validated.
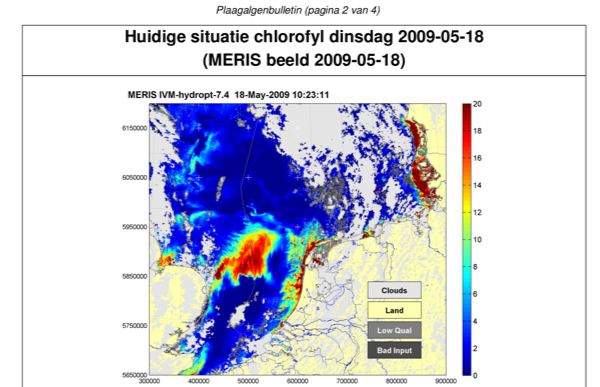
Water Insight provided the Ministry of Infrastructure and Water Management (through its agency Rijkswaterstaat) with Harmful Algal Bloom bulletins in the period 2006 - 2012, covering the Dutch part of the North Sea. The service ended with the outage of the MERIS sensor. Although an automated service was processing data twice a week, the bulletins were reviewed and annotated by an in house expert to assist RWS in the use of this new data type. A similar service was run in a Water Insight project in the Danube Delta.